
Spectrum Analyzer manufacturers:
Keysight fieldfox 9912
TTI PSA series
Rohde & Schwarz FSH3,
RF Explorer
TINYSA
CLASSES IN RF COORDINATION
BEST AUDIO RF
SHURE WIRELESS
SOUNDFORUM RF
TV TECHNOLOGY
RFVENUE
BESSER ASSOC
RF COORDINATION SOFTWARE:
PROFESSIONAL WIRELESS IAS
SHURE WIRELESS WORKBENCH
IPHONE FREQUENCY FINDER
LECTRO WIRELESS DESIGNER
EAZYRF
getfreqs.com
soundbase.app
Ryan Stotts' Directions for Converting csv Files from R&S FSH to
Professional Wireless IAS and Shure Wireless Workbench 6.
The Rohde & Schwarz FSH-3 has a limit of 301 lines in it’s CSV scan files. So depending on your desired resolution of the scan file, if you take a 30MHz scan it will output a 100kHz step integer in the .csv file. If you take a 60MHz scan it will output a 200kHz step integer and so on. Lately I have been using 60MHz scans so I take 4 scans 470-530MHz, 530-590MHz, 590-650MHz & 650-710MHz in the UHF range. Because of new product developments Ryan has been taking scans in the low and hi VHF spectrum as well.
Open workbench and under the coordination page, click on “Change Scan Data”. Under "Scan Data Files” click on the folder icon to the right of the boxes that will prompt you to open a file. Select the file you want. You can have multiple scan files imported. Click close and view the scan on the page. Drag the exclusion line and start finding freqs.
If you open a csv from the R&S in MS Office, delete the header, move the visible values to the right of the decimal point so you can only see the hundredth and save, it has to be saved as a CSV for Windows (which is in the save-as options). Mac by default outputs a csv mac file that WWB6 hates.

Great resource…
Matt Dale's automation script for RF explorer
Matt Dale from Masque/PWS wrote a script for the RF Explorer to automate data collection that might help some of your users that don't have access to a TTI. He turned the script into an EXE file for Masque/PWS for our tours and location scans, but the basic script does nice job of collecting data.
https://github.com/RFExplorer/RFExplorer-for-Python/wiki
Please use it and send feedback about the script to Matt. It takes about 12 -15 minutes to collect from 450.00 to 698.000 for a simple DTV sweep. Since it is written in Python, it is extremely easy to change parameters and to customize.
When you download this file keep it and all the folders intact. Your TTI expects to find the setup files within the PSA folder.
This link, above, is a zip file of my TTI setup files with most of the standard scans set for the most useful resolution as listed to the left.
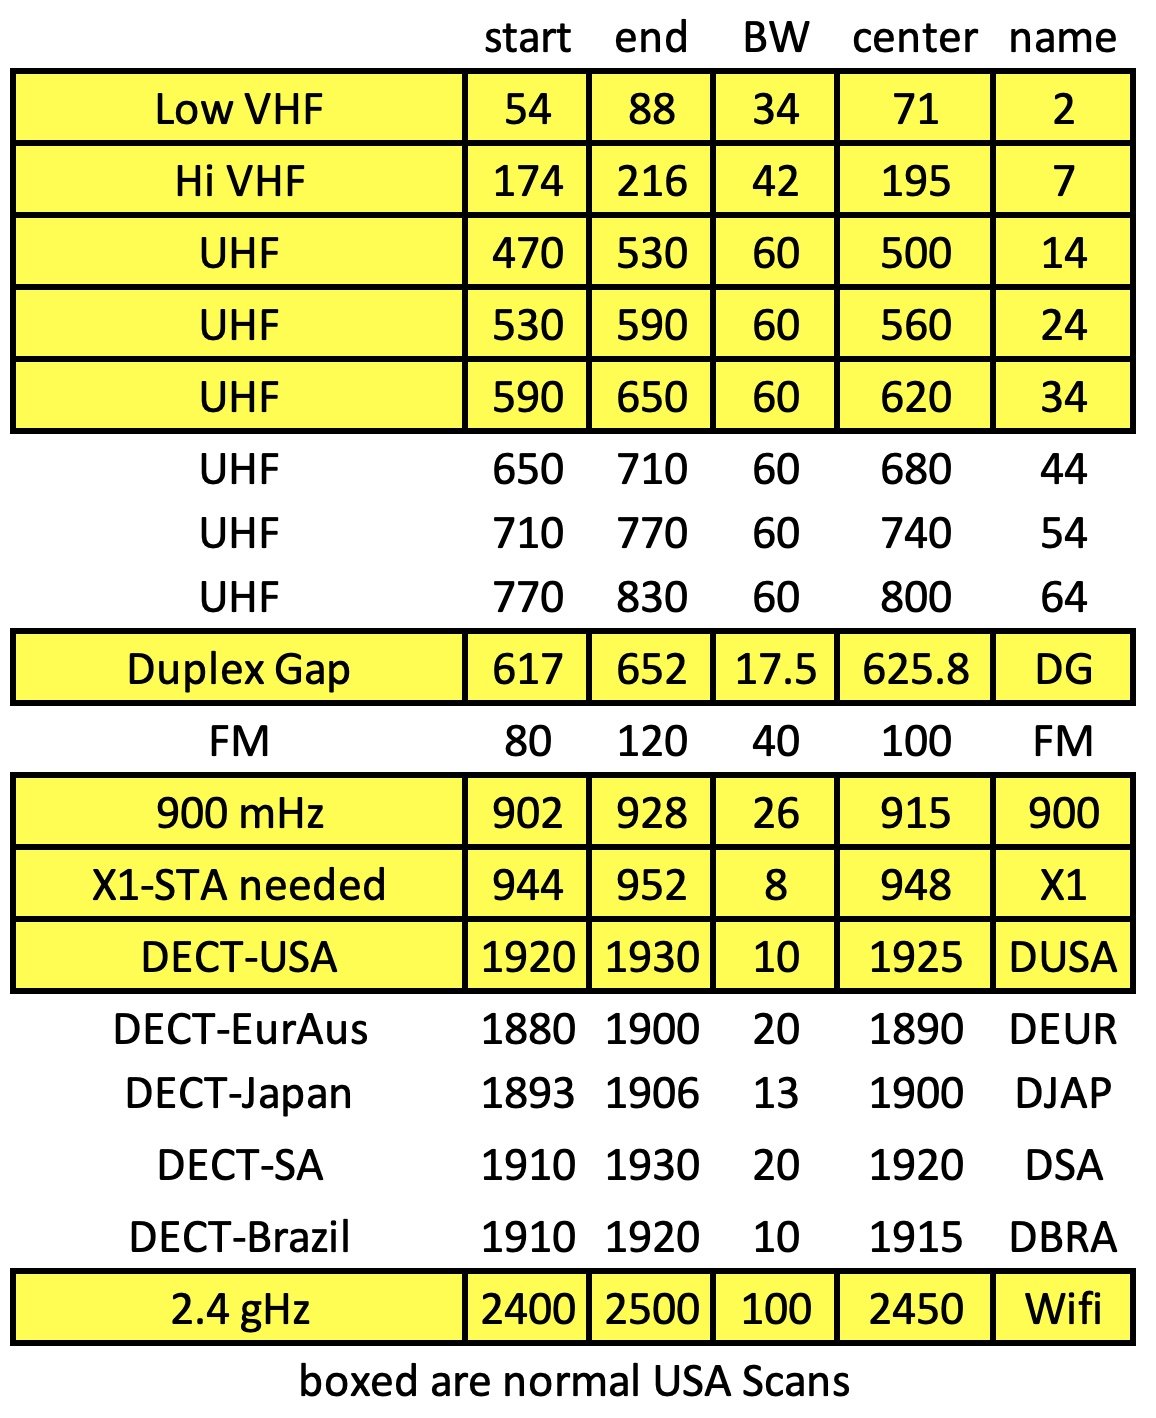
This is a cheat sheet I tape to my PSA which shows the setups and what they cover. (click to get it in excel)
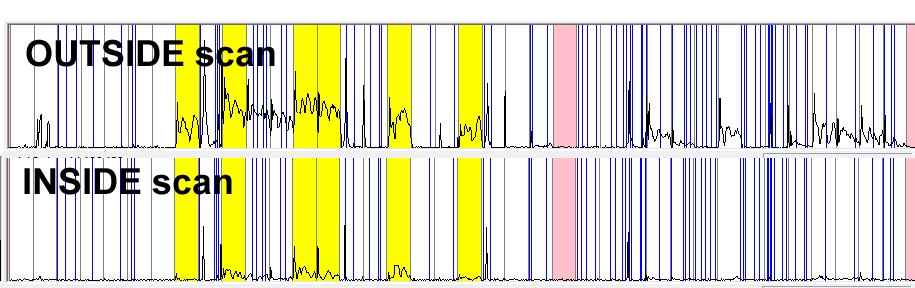
Here is an example of the RF levels outside a venue vs inside. Notice the shielding effect of the venue...only the yellow channels have been flagged by me as DTV to avoid.
Here is the IAS Version 5 software. In addition to the ribbon type of tool interface, the software has been rewritten to do narrow band AM frequencies such as used by the Radio Active Design's UV-1G intercom system.
Also, when you import your scan the option is given to also share it with other users. see the "Share with other users" button at the bottom.
When you use the TV wizard not only do you get the FCC database information, but you are offered scans from other users in the same area. Here my scan is offered:
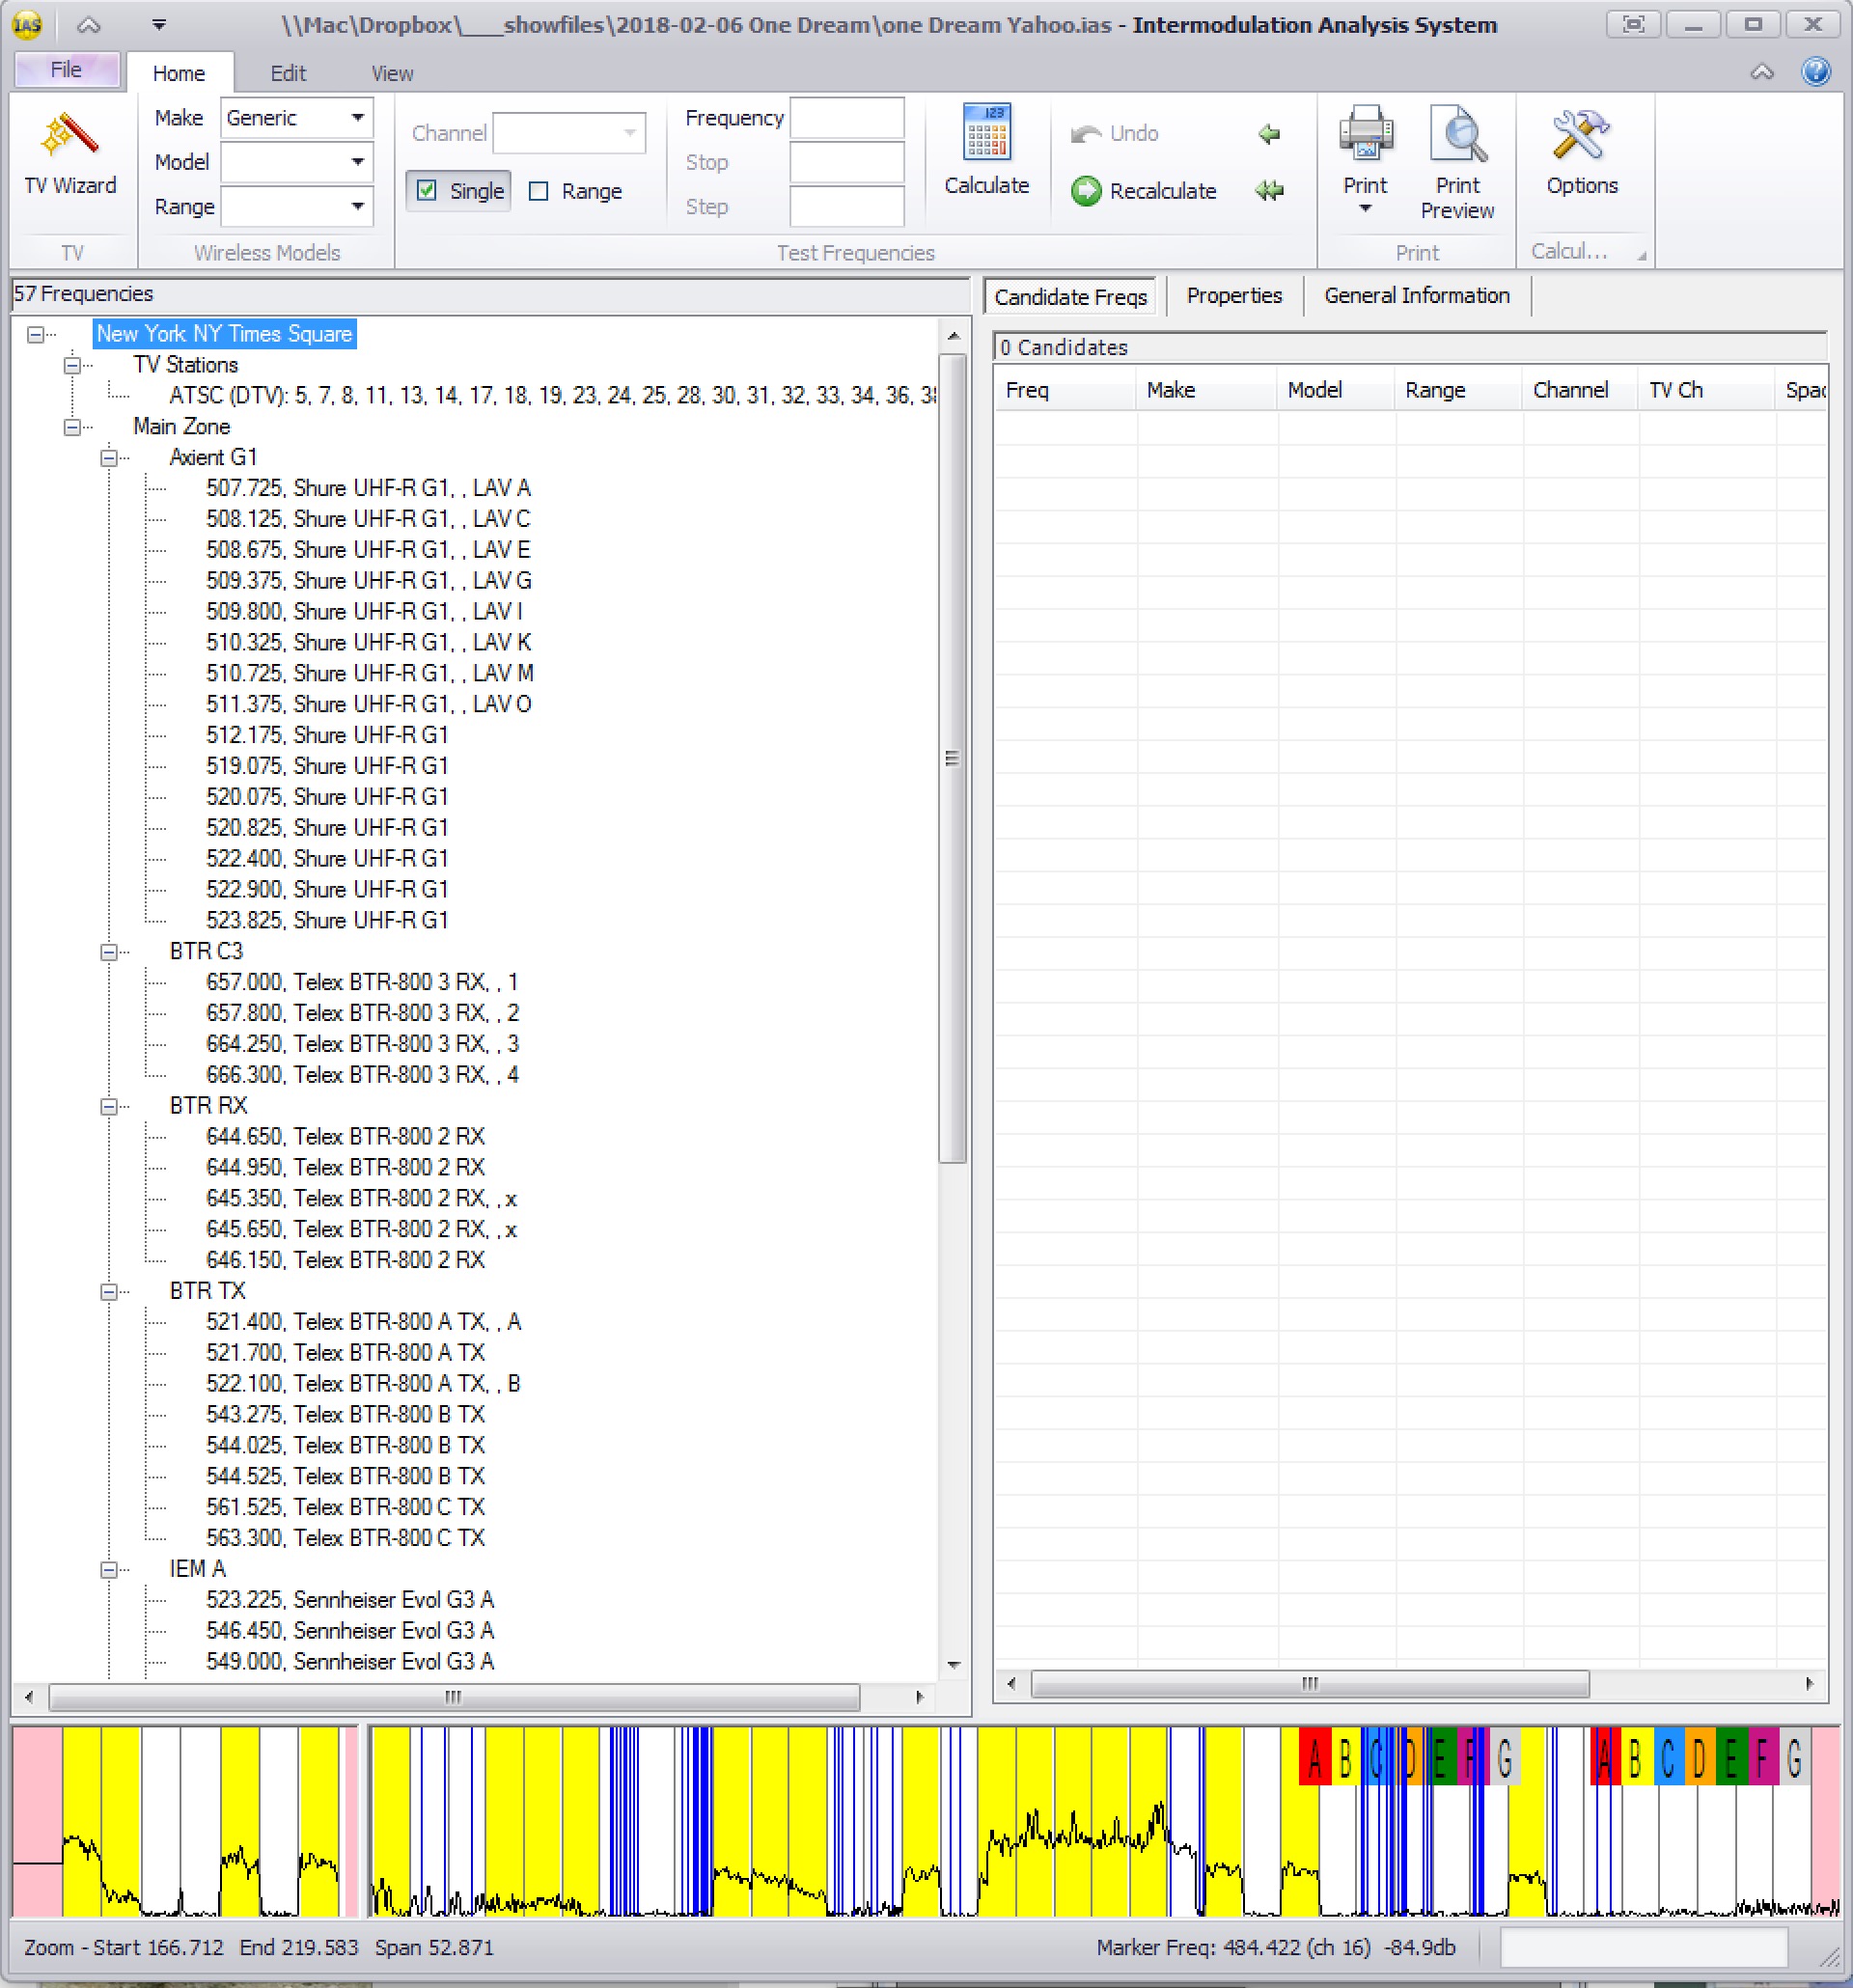
This is what the spectrum scans look like when entered in IAS. Basic information listing for the show at the top of the coord is downloaded from the FCC website and initially sets the DTV channels as yellow. After the actual scan is entered, I can manually right click on each channel and turn on or off the yellow DTV indicator. The scan above from New York, NY Times Square is overlaid on the channels. Yellow channels are DTV. Some yellow channels show no DTV. I have left them active since the FCC database shows them as DTV. The channels might come on at any time.

The colored letters on the right indicate bands which were sold off in the 600MHz auction.
IAS frequency calculation sometimes needs to avoid another show's frequencies. Here is how to do it.
IAS and Workbench coords - Part 1
IAS and Workbench Part 2
Here Zaxcom mics have been coordinated into channel 24 and then the DTV flag turned on to exclude further freqs.
This method is also useful to force particular frequency selection into a channel. Temporally turn on the yellow DTV indicator in all the channels that you want to exclude. Then select your freqs. Recently, I wanted to have three Zaxcom freqs in one TV channel and nothing else. After I selected the freqs, I turned on the DTV yellow in that channel to keep further freqs out. Here is the result.